-
December 17, 2012: Financial Repression: What To Do With Your Investments
We discussed the concept of financial repression around the globe and its ramifications on investments. Several ways to cope with this ongoing repression are further discussed.
-

December 10, 2012: How Asset Allocation Strategies Performed In Secular Market Trends
We look at the longest history relative strength based asset allocation portfolio to understand how strategic and tactical perform in various secular markets.
-

December 3, 2012: Asset Trends & Correlations For Portfolio Construction
We discuss how asset trends & correlations can be used for portfolio construction.
-

November 26, 2012: College Savings 529 Plan Investment Portfolio Management
College savings 529 plans have many tax advantages and some serious drawbacks. We discuss and review some of portfolio management styles for this kind of plans.
-

November 19, 2012: Asset Trends & Correlations
Asset trends and their correlations can serve as good indicators for short and long term major asset behaviors. They are useful references and can be also important educational materials to help reinforce diversification and risk management concepts.
-

November 12, 2012: Multiple Portfolios As Another Diversification Dimension
Using multiple portfolios and/or strategies can increase diversification effect and better your investment behavior.
-

November 5, 2012: 401K Investment Portfolio Management
This newsletter discusses 401K investment portfolio management issues including asset allocation and how to handle regularly added new money from salary deduction.
-

October 29, 2012: Sharpe, Maximum Draw Down And Sortino Ratios
We discussed Sharp ratio, maximum drawdown and Sortino ratio, all of which are important metrics for portfolio behavior measurement.
-

September 24, 2012: Tax Efficient Investing
We discussed the tax efficiency of tactical and strategic asset allocation portfolios using our recently released tax performance estimator.
-
September 17, 2012: 8 Harmful Behaviors For Your Portfolios
The 8 harmful behaviors in portfolio implementation are discussed. … the more serious question one should always ask is: What happens if my behavior is wrong (or go against my thinking)? What should I do?
-

September 3, 2012: New Features & Low Cost ETFs For Prime Time
New features: get started now, fund expense ratios for plans. Portfolio expense ratios and dividend yields. Low cost ETFs such as those from Vanguard are ready for prime time.
-
August 20, 2012: Financial Crises, National Crises, World Crises And Diversification
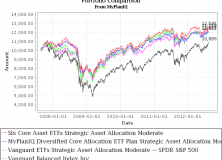
Re-balance Cycle Reminder Based on our monthly re-balance calendar, the next re-balance time will be on Monday, September 10, 2012. You can also find the re-balance calendar of 2012 on ‘My Portfolios’ page. As a reminder to expert users: advanced portfolios are still re-balanced based on their original re-balance schedules and they are not the same as those used in Strategic and Tactical Asset Allocation (SAA and TAA) portfolios of a plan. Also please note that we now list the next re-balance date on every portfolio page. Portfolio Diversification: The First Line Of Defense We are in a world of constant changes: financial bubbles and crises, national & political unrests, global disasters and wars, etc. Furthermore, these events last from several months to years, not short time spans for a human life. To make matters worse, investors are in constant barrage of news, advises and noises. For most investors, fortunately, your first line of defense is to construct a diversified portfolio. By diversification, we mean you invest in assets (or asset classes — a more academic term) that should have sound, intuitive and historical data backings to their positive average (expected) returns. We alluded this concept in our previous newsletter July 4th 2011: What Make Strategic Asset Allocation Work? It is interesting to read a recent commentary by PIMCO’s Bill Gross that bashes equities. We might concur with Mr. Gross’s conclusion that equities will have trouble in the coming decade. However, we believe his reasoning is flawed as he uses GDP growth as the sole yard stick to justify his reasoning. We believe, as what was stated in our previous newsletter, the risk premium that enables entrepreneurs to take a risk for better returns plays an equally (or more) important role in supporting the argument that broad base equity or stock indices (such as S&P 500) derive above cash average returns in the long term. A portfolio with diversified asset classes can sustain loss in severe crises much better those that are non diversified such as a full stock portfolio. Recent stock market strengths have made headlines like Total Returns of Stock Market Near All Time High. However, for a balanced or diversified portfolio, it has recovered from the 2008-2009 loss completely much earlier. The following chart shows how diversified balanced portfolios have performed, compared with S&P 500 (SPY) total return: From the above chart, one can see that all the diversified portfolios completely recouped their loss in late 2010, almost two years earlier than S&P 500 (SPY). A more useful historical performance metric is the so called rolling 5 years (or rolling 3, 10 years) performance. The following chart shows how two diversified portfolios compared with stocks and 10 year Treasury Bonds (TBond) since 1928. Data are from NYU’s professor Aswath Damodaran. 33-34-33 represents 33% stocks, 34% Treasury Bills (3 months, usually treated as cash) and 33% Treasury Bonds (1o years). There are two periods that the balanced portfolios had negative rolling 5 year returns: both 33-34-33 and 60-20-20 portfolios had consecutive 3 years (1932, 1933, 1934) negative rolling 5 year returns in the great depression. Both had one (1941) negative rolling 5 year return in World War II. Even though it created discomfort that in the great depression, the balanced portfolios suffered from loss for a relatively long period of time, in the real return sense (i.e. return minus inflation or Consumer Price Index (CPI)), they were actually positive as CPI had following since 1927 till 1935. It then fell again in the early years (1938, 1939) of World War II. For equity (stock) investors, the above chart illustrates double dip negative rolling 5 year returns from 2000 to now, a pattern similar (though less severe) to the Great Depression. No wonder the recent recession has been called The Great Recession. Notice that if you add Gold to the balanced portfolio, it is the permanent portfolio. In our previous article Harry Browne’s Permanent Portfolio Long Term Performance, we showed the historical year by year performance since 1970. Unfortunately, before 1968, gold price had been fixed relative to the U.S. dollars and thus it is meaningless for such a portfolio going back from 1968. From 1970 to 2011 (42 years total), one can easily see that the portfolio only had 5 individual year loss and it should not have any negative rolling 5 year return either. The lesson from the above is that a diversified portfolio can help one cushion from severe blows even though these portfolios can still suffer from meaningful loss in one or two years. As long as you stick to a well balanced and conservative portfolio and willing to weather through a few years of discomfort (without panic that can result in abandoning equities or investment portfolios all together), you will do fine. This is even more true for a retirement plan account which presumably you might not need the money (for most people) for many years. However, if you need money within 5 years, you might want to consider to put aside some money in short term investments to cover that. Market Overview We maintained our cautious attitude to the recent stock market strength. Again, we have not seen any meaningful or substantial structural change in the U.S., European and emerging market economies. However, we will let markets sort this out and will try to take advantage over its irrational behavior if it is possible. For the time being, from 360° Market Overview, Gold (GLD) is now ranked at the bottom in the major asset class trend rankings. This reflects markets’ transient guess for the upcoming Goldilocks economy, a period without central banks and/or governments intervention and low inflation? Nobody knows for sure. It is thus even more important to have diversified and/or hedge portfolios. We again would like to stress for any new investor and new money, the best way to step into this kind of markets is through dollar cost average (DCA), i.e. invest and/or follow a model portfolio in several phases (such as 2 or 3 months) instead of the whole sum at one shot. Portfolio Review Even with recent long term Treasury bonds’ weakness and anemic gold performance, permanent portfolios have remained steady, though lagging behind others. The following compares several permanent portfolios: Portfolio Performance Comparison (as of 8/20/2012) Portfolio/Fund Name 1 WeekReturn* YTDReturn** 1Yr AR 1Yr Sharpe 3Yr AR 3Yr Sharpe 5Yr AR 5Yr Sharpe Permanent Global Portfolio ETF Plan Strategic Asset Allocation Moderate 0.1% 5.7% 4.7% 19.8% 9.6% 80.3% 5.3% 29.2% PRPFX 0.4% 3.5% -1.0% -19.1% 11.2% 113.0% 8.5% 62.7% VBINX 0.5% 9.4% 18.2% 117.8% 11.3% 107.8% 4.3% 25.3% Permanent Income Portfolio -0.8% 5.0% 10.2% 220.9% 11.1% 213.8% 7.1% 96.6% Harry Browne Permanent Portfolio -0.2% 4.8% 5.1% 72.8% 11.7% 179.3% 8.9% 104.6% *: NOT annualized **YTD: Year to Date See more detailed comparison >> Latest Articles
- Gold Descends To The Bottom Among Major Assets
- Tried and True Money Advice from Warren Buffett
- Why Goldman Refuses To Raise Its S&P 1250 Year End Forecast
- The Rationale For Momentum
- Total Returns of Stock Market Near All Time High
- Earn more money! A simple way toward building wealth
- How Your 401k Really Grows: Savings
- The Truth About the “Impending” Recession
- Valuable Property: REITs
- Muni Forecast: Lots of Clouds
- The Power of Effective Diversification
- Doug Kass: Why the Market has Hit the High for the Year
- Stable Value Funds Serve Investors But Scare Plan Sponsors
- August 13, 2012: Effective Safe Harbor Cash And Short Term Investments
How can we improve this newsletter — we value your inputs –Thanks to those who have already contributed — we appreciate it. RSS Feed Disclaimer: Any investment in securities including mutual funds, ETFs, closed end funds, stocks and any other securities could lose money over any period of time. All investments involve risk. Losses may exceed the principal invested. Past performance is not an indicator of future performance. There is no guarantee for future results in your investment and any other actions based on the information provided on the website including, but not limited to, strategies, portfolios, articles, performance data and results of any tools. All rights are reserved and enforced. By accessing the website, you agree not to copy and redistribute the information provided herein without the explicit consent from MyPlanIQ.
-
August 13, 2012: Effective Safe Harbor Cash And Short Term Investments
Re-balance Cycle Reminder Based on our monthly re-balance calendar, the next re-balance time will be on Monday, September 10, 2012. You can also find the re-balance calendar of 2012 on ‘My Portfolios’ page. As a reminder to expert users: advanced portfolios are still re-balanced based on their original re-balance schedules and they are not the same as those used in Strategic and Tactical Asset Allocation (SAA and TAA) portfolios of a plan. Also please note that we now list the next re-balance date on every portfolio page. Safe Harbor: Cash & Short Term Investments As one of the four pillars in the four pillar investment framework (see August 6, 2012: Four Pillar Foundation Based Portfolio Review) , cash & short term investments play an essential role in portfolio construction and overall personal finance. However, they are often considered boring. Many believe that they can not do much on these investments (or savings). Moreover, given today’s extremely low rate environment, investors almost give up how to maximize returns on them. Let’s first take a look at why cash & short term investments are important:
- You have to maintain a portion of cash to fund your immediate spending for a minimum one month period, often several months or up to several years.
- Cash is called safe harbor in portfolios for the reason that it is the last resort to fight against uncertainties when you face an uncertain economic direction call on inflation, deflation and/or growth.
- Cash is the great stabilizer for portfolio re-balancing.
At MyPlanIQ, we advocate a balanced and somewhat conservative approach in portfolio construction. For example, we never believe that 100% in stocks or equities is the best way to grow your wealth, even in a very long term investment horizon. Many great investors, even equity investors, are not afraid to accumulate cash when opportunities are rare and good investments are hard to find. Now let’s look at how one can enhance cash and savings returns, even in today’s low rate environment. There are still various ways to structure your cash and short term savings for better gains. The following are the most common cash and short term investments:
- Bank checking: In general, checking accounts pay the least interests. We recommend that you find a savings account with check writing capability. Even if your bank does not offer saving accounts with check writing, you should just maintain a minimum balance for the checking account and use electronic payment for your credit card and other payments, if it is possible.
- Savings accounts. In general, many banks offer savings accounts that have higher interests than checking.
- Money market accounts (MMA): these are the products offered by banks. The difference between a savings account and MMA is that some MMAs do not offer or limit number of checks per month (such as 6 checks per month). Since the interest difference among MMAs or savings accounts offered by various banks can be as high as 0.5% to 1% (see, for example, bankrate.com’s MMA rates), it is worth trouble to find a bank that offers high interests, especially given today’s easy electronic money transfer (ACH). If you have relatively large sum of cash (For example, 1% of $10,000 would give you $100 a year, good enough to pay for your MyPlanIQ’s basic subscription).
- Short term CDs (< one year) and long term CDs (up to 5 years): in general, one year or shorter maturity CDs are still worth trouble. But given other short term investments that can offer much higher interest payments, one should avoid using CDs with longer than one year maturity.
- Brokerage or retirement plan money market funds: these funds usually offer similar rates as MMAs. But these days, this is no longer true. For example, Schwab’s money market funds have miserable 0.01% (taxable treasury money market) to 0.06% interest rates (money market sweep funds). Even for higher yield money market funds (with $100,000 minimum), the rate is still a pitiful 0.13%.
- Stable value funds: many retirement (401k, 403b) plans offer stable value funds. These funds usually invest in bonds but have a guarantee contract with insurance companies for a minimum return. One of the well know stable value funds is G Fund in the Thrift Savings Plan (TSP) offered to federal employees. This fund invests a specially issued (non-marketable) short term Treasury security that offers long term (4 or more years) Treasury interest payments. In general, stable value funds offer higher returns than short term cash.
- Short term bond funds: they can be further broken down to taxable U.S. government and agencies bond funds, tax exempt municipal bond funds and broad base short term bond funds and investment grade bond funds. In general, you can purchase these bond funds in a brokerage account. Typically, if you only need a portion of cash beyond 2 years, you can consider using short term bond funds, especially short term federal (government & agencies) and/or short term bond index funds. See more detailed explanation and performance comparison below.
- Target maturity individual bonds or bond funds (ETFs): for investments with more than one year horizon, you can purchase individual bonds with target maturity. However, not only this requires large cash amount, it also incurs various risks and efforts such as how to select these individual securities. Enter the target maturity bond ETFs such as Guggenheim BulletShares ETFs. See article Compare CD Interests And Yields From Defined Maturity Bond ETFs. The good news for the BulletShares ETFs is that they offer both investment grade and high yield target maturity bond funds. A simple and somewhat aggressive strategy is to invest shorter term (such as 1 or 1.5 year) cash to high yield bond ETFs with similar target maturity while invest longer term (2-3 years) cash in investment grade bond ETFs with the same maturity. We feel target maturity bond ETFs are good choices longer term cash investments and hope we will see more such offerings with lower expenses in the future.
The following table compares the performance of Vanguard short term bond funds: Portfolio Performance Comparison (as of 8/10/2012) Portfolio/Fund Name 1 WeekReturn* YTDReturn** 1Yr AR 1Yr Sharpe 3Yr AR 3Yr Sharpe 5Yr AR 5Yr Sharpe VFISX -0.1% 0.4% 0.5% 43.5% 2.0% 131.3% 3.6% 141.1% VBIRX -0.1% 1.4% 1.5% 101.5% 3.3% 167.8% 4.5% 144.6% VFSTX 0.1% 3.0% 2.8% 191.2% 4.5% 251.8% 4.3% 144.5% VSGBX -0.1% 1.0% 1.3% 106.7% 2.8% 162.7% 4.2% 161.3% VWSTX 0.0% 0.8% 1.1% 213.6% 1.3% 232.4% 2.4% 234.5% *: NOT annualized **YTD: Year to Date VSGBX (As of 08/10/2012) Vanguard Short-Term Federal Inv VFSTX (As of 08/10/2012) Vanguard Short-Term Investment-Grade Inv VBIRX (As of 08/10/2012) Vanguard Short-Term Bond Index Adm VFISX (As of 08/10/2012) Vanguard Short-Term Treasury Inv VWSTX (As of 08/10/2012) Vanguard Short-Term Tx-Ex Five Year Chart For year by year complete history of these bond funds, visit this link and click on ‘+ More Performance Analytics Comparison‘. The following table shows the rolling 2 year performance for these bonds funds, courtesy of soundmindinvesting.com: Market Overview We are still very cautious on current market environments. Even though markets continued to exhibit risk on up trends (for risk assets), we would like to stress for any new investor and new money, the best way to step into this kind of markets is through dollar cost average (DCA), i.e. invest and/or follow a model portfolio in several phases (such as 2 or 3 months) instead of the whole sum at one shot. Based on 360° Market Overview, U.S. REITs had over -2% loss last week while general U.S. stocks rose more than 1%, an apparent sector rotation from winners to runner-ups. With the hope of another QE diminishing every day, U.S. stocks are now left on its own while gold (GLD) is still at the bottom of the table. Allocation funds listed on SmartMoneyIQ Managers usually have excellent long term records. These funds are again very steady in the current uncertain markets. On the bond fund side, we see good bond funds such as PIMCO total return (PTTRX) still maintains steady and high exposure in intermediate term Treasuries. This contrasts with risk assets (stocks) rising trends. Portfolio Review We now revisit our tactical featured ETF portfolios: Portfolio Performance Comparison (as of 8/10/2012) Portfolio/Fund Name 1 WeekReturn* YTDReturn** 1Yr AR 1Yr Sharpe 3Yr AR 3Yr Sharpe 5Yr AR 5Yr Sharpe Vanguard ETFs Tactical Asset Allocation Moderate -0.3% 7.5% 13.1% 187.4% 11.1% 92.6% 8.7% 63.6% Permanent Global Portfolio ETF Plan Tactical Asset Allocation Moderate -0.1% 3.0% 1.7% 19.9% 11.0% 88.9% 8.6% 65.0% Six Core Asset ETFs Tactical Asset Allocation Moderate -0.3% 4.8% 4.5% 70.9% 7.6% 65.5% 8.4% 68.1% Retirement Income ETFs Tactical Asset Allocation Moderate -0.8% 3.9% 9.7% 121.3% 12.4% 109.2% 8.0% 66.5% MyPlanIQ Diversified Core Allocation ETF Plan Tactical Asset Allocation Moderate -0.6% 5.2% 4.7% 67.7% 9.0% 76.0% 9.4% 77.1% *: NOT annualized **YTD: Year to Date All portfolios lost some nominal amount last week, mostly due to bond and REITs weakness. See Latest Featured ETF Tactical Portfolios Performance Comparison >> Latest Articles
- Long Term Bonds And Stock Futures: PIMCO StocksPlus Fund Delivered Stellar Performance
- GMO: Reports of the Death of Equities Have Been Greatly Exaggerated: Explaining Equity Returns
- Investors’ 10 Most Common Behavioral Biases
- Emerging Market, Long Term Treasury And High Yield Bonds Are Still On Top
- Stock Market Trend Watch: Large Cap Stocks Still Outperform
- Gary Shilling: U.S., Europe and China In A Global Recession
- Invest Like Buffet With Wide Moat Mutual Funds And ETFs
- Ignore the Politicians and Take Control of Your Financial Freedom
- Finding a haven from volatility isn’t easy
- August 6, 2012: Four Pillar Foundation Based Portfolio Review
How can we improve this newsletter — we value your inputs –Thanks to those who have already contributed — we appreciate it. RSS Feed Disclaimer: Any investment in securities including mutual funds, ETFs, closed end funds, stocks and any other securities could lose money over any period of time. All investments involve risk. Losses may exceed the principal invested. Past performance is not an indicator of future performance. There is no guarantee for future results in your investment and any other actions based on the information provided on the website including, but not limited to, strategies, portfolios, articles, performance data and results of any tools. All rights are reserved and enforced. By accessing the website, you agree not to copy and redistribute the information provided herein without the explicit consent from MyPlanIQ.
-
August 6, 2012: Four Pillar Foundation Based Portfolio Review
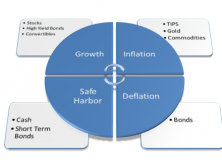
Re-balance Cycle Reminder We had a re-balance today. Based on our monthly re-balance calendar, the next re-balance time will be on Monday, September 10, 2012. You can also find the re-balance calendar of 2012 on ‘My Portfolios’ page. As a reminder to expert users: advanced portfolios are still re-balanced based on their original re-balance schedules and they are not the same as those used in Strategic and Tactical Asset Allocation (SAA and TAA) portfolios of a plan. Also please note that we now list the next re-balance date on every portfolio page. Four Pillar Foundation Based Portfolio Review We first introduced the concept of four corner based investment framework in the newsletter April 23, 2012: All Weather Portfolio Construction. We prefer using the term of ‘Four Pillar Foundation‘. To recap, we showed the following picture in the introductory article: We made an important distinction between Treasury Inflation Protected Securities (TIPs) and other fixed income bonds. From the above picture, one can clearly see bonds can fall into all four corners! Given markets up and down with natural economic forces and artificial government (or politics driven) intervention coming into play, it is a good time to look at portfolios that are based (explicitly or implicitly) on this four pillar framework:
- Permanent portfolios: these are the portfolios that are based on Harry Browne’s original four corner framework which is essentially the same as our four pillar framework.
- Harry Browne Permanent Portfolio
- Permanent Income Portfolio
- P Permanent Portfolio ETF Version
- PRPFX (Permanent Portfolio Fund)
- PERM (Global X Permanent ETF)
- Doug Roberts Follow The Fed portfolio: P Doug Roberts Follow the Fed Add Treasury Note One Month Simple Indicator Moving Average 64 Days. This portfolio is on ‘Advanced Users’ page that requires expert subscription. It divides a portfolio into 3 equal parts:
- 33% in intermediate Treasuries
- 33% in growth corner that switches between US large cap stocks and small cap stocks.
- 33% in inflation/deflation corner that switches between gold or long term Treasuries
- Yale’s P David Swensen Yale Individual Investor Portfolio Annual Rebalancing. One can classify its 6 ETFs into the following categories
- Growth: 30% in US stocks, 15% in international stocks and 5% in emerging market stocks. Total 50%.
- Inflation: 15% in TIPs and 20% in US REITs. US REITs can be classified to Growth category too. Total 35%
- Deflation: 15% in long term Treasuries.
The second and third portfolios are not directly related to the four pillar framework but they are constructed with these concepts in mind. We believe the four pillar framework is very intuitive and helps to classify various investments related to economic cycles. This is especially true for bonds:
- Growth: high yield bonds, convertible bonds.
- Inflation: TIPs, Emerging and international bonds (these two are more for currency value preservation for a global investor)
- Deflation: Long term bonds, intermediate corporate bonds.
- Safe harbor: cash and short term bonds.
So next time when you see bonds in your portfolio, don’t just simply lump them into fixed income or ‘safe’ asset. They actually serve for various purpose. In fact, you are encouraged to use our ‘Static Portfolio’ tool to construct a ‘permanent’ portfolio using ALL bonds, similar to our Permanent Income Portfolio (which uses dividend stocks and REITs). Note that even for a retiree, we believe some dividend stocks and REITs (up to 20%, for example) are still required to construct an optimal portfolio, even from risk point of view. See our previous newsletter June 25, 2012: Conservative Allocation Fund Upgrading. It is also very important to remember that not all bond funds are safe. In fact, at MyPlanIQ, we have done quite research in how to properly handle various bond funds, especially for long term, high yield and international and emerging market bond funds. These bond funds lie in the risky spectrum of the fixed income and need special treatment. This is why we did some re-classification of long term bond funds starting in the last re-balance period (i.e. the July re-balance). For expert users, another way to apply the four pillar framework concept in constructing a portfolio is to construct sub portfolios to cover growth (equities), inflation and deflation corners. Similar to Doug Robert’s Follow the Fed, these sub portfolios can use our Tactical Asset Allocation strategy (for example, set risk profile to 0 to construct an all equity portfolio) or Goldman Sachs Global Tactical Allocation strategy to rotate between gold and TIPs for inflation corner and long term bonds and intermediate or short term bonds for deflation. Such a composite portfolio gives two levels of hedging: one is at the four corner side and the other is at each corner. Finally, let’s take a look at the performance among these portfolios. Bear in mind that some portfolios have higher risk. For example, David Swensen’s portfolio has only 30% in fixed income. So the comparison is not entirely apple to apple. Portfolio Performance Comparison (as of 8/6/2012) Portfolio/Fund Name 1 WeekReturn* YTDReturn** 1Yr AR 1Yr Sharpe 3Yr AR 3Yr Sharpe 5Yr AR 5Yr Sharpe Harry Browne Permanent Portfolio -0.3% 5.1% 9.4% 108.3% 12.0% 175.1% 8.8% 103.0% P David Swensen Yale Individual Investor Portfolio Annual Rebalancing 0.4% 9.7% 15.5% 71.2% 14.2% 106.7% 5.1% 25.2% P Doug Roberts Follow the Fed Add Treasury Note One Month Simple Indicator Moving Average 64 Days -0.2% 4.7% 4.8% 13.7% 13.7% 118.4% 9.7% 77.2% P Permanent Portfolio ETF Version -0.1% 3.1% -0.5% -27.5% 11.4% 114.6% 8.3% 67.7% PERM 0.1% 0.0% Permanent Income Portfolio -0.2% 6.6% 13.2% 243.1% 12.3% 229.2% 7.5% 101.1% PRPFX 0.3% 3.1% -0.3% -29.1% 11.0% 123.4% 8.2% 52.4% *: NOT annualized **YTD: Year to Date Note PERM’s Inception is 02/09/2012. See complete detailed and latest comparison >> Year to date, P David Swensen Yale Individual Investor Portfolio Annual Rebalancing has done the best. This is due to its sizable exposure in US stocks, REITs, TIPS and Long Term Treasuries, all of which have done well. Similarly, Permanent Income Portfolio has done well due to its dividend stock exposure, in addition to TIPS, Long Term Treasuries and REITs. On the other hand, gold’s performance has been lackluster, which affects traditional permanent portfolios. Notice how well our P Permanent Portfolio ETF Version portfolio has matched to the permanent portfolio mutual fund PRPFX. Looking ahead, we are concerned about the diminishing returns on long term bonds and TIPs. However, deflation pressure is still mounting in real economies and no one knows when that will end. This is exactly the reason why one should choose a diversified investment framework such as the four pillar one as the investing foundation. Market Overview Due to the recent stock market surge, some of our tactical portfolios might choose to increase stock exposures. However, we remain very skeptical on the fundamentals. But as a disciplined investor, however unconvinced we are, we choose to stick to the strategy and let the markets and natural laws of statistics play out. Based on 360° Market Overview, other than gold (GLD) and frontier market stocks (FRN), all risk assets are now ranked higher than cash. Even international stocks (EFA) is now above the total bond index (BND). Also notice how stretched US REITs (VNQ) has risen: in the past 52 weeks, it had return of 42.33%. US stocks (VTI) had 26.59% 52-week return. In the meantime, gold (GLD) and commodities (DBC) are the only two that had negative 52-week returns. Allocation funds listed on SmartMoneyIQ Managers usually have excellent long term records. Again, we are seeing these managers are very steady in the current uncertain markets. Latest Articles
- ‘Macro Funds’ Struggling
- Investing In Gold: The Pros And Cons
- GMO Long Term Asset Forecast for Inflation Fighting
- Doug Short: The Big Four Economic Indicators With Updated Employment Data
- Martin Pring: Growth Recession That Might Be Postponed?
- 10 Best Moderate Allocation Mutual Funds
- 12% of Millionaires Are Educators
- Sector Watch: Low-Beta Stocks
- Investors Continued To Pull Money Out Of Stock Funds
- Why We Don’t Buy Low And Sell High
- Doug Short: Is the Stock Market Cheap?
- Slaughtering Sacred Cows: Economic Growth and Equity Performance
- What is Your Pension Really Worth?
- Top 10 World Allocation Mutual Funds
- Even Balanced Portfolios Correlate Strongly to Stocks
- July 30, 2012: Strategic Asset Allocation & Lazy Portfolios Review
- How can we improve this newsletter — we value your inputs –Thanks to those who have already contributed — we appreciate it.
RSS Feed Disclaimer: Any investment in securities including mutual funds, ETFs, closed end funds, stocks and any other securities could lose money over any period of time. All investments involve risk. Losses may exceed the principal invested. Past performance is not an indicator of future performance. There is no guarantee for future results in your investment and any other actions based on the information provided on the website including, but not limited to, strategies, portfolios, articles, performance data and results of any tools. All rights are reserved and enforced. By accessing the website, you agree not to copy and redistribute the information provided herein without the explicit consent from MyPlanIQ.